Affinity Diagram
An affinity diagram is a tool used to organize ideas and data.
Business Analysts commonly use this tool to allow large numbers of ideas to be sorted into groups for review and analysis. The affinity diagram can help BAs define issues related to a problem or opportunity.
- Start with Posting a Topic or Problem as Given (PAG).
- Record as many reasons for the PAG as you or your group can think of.
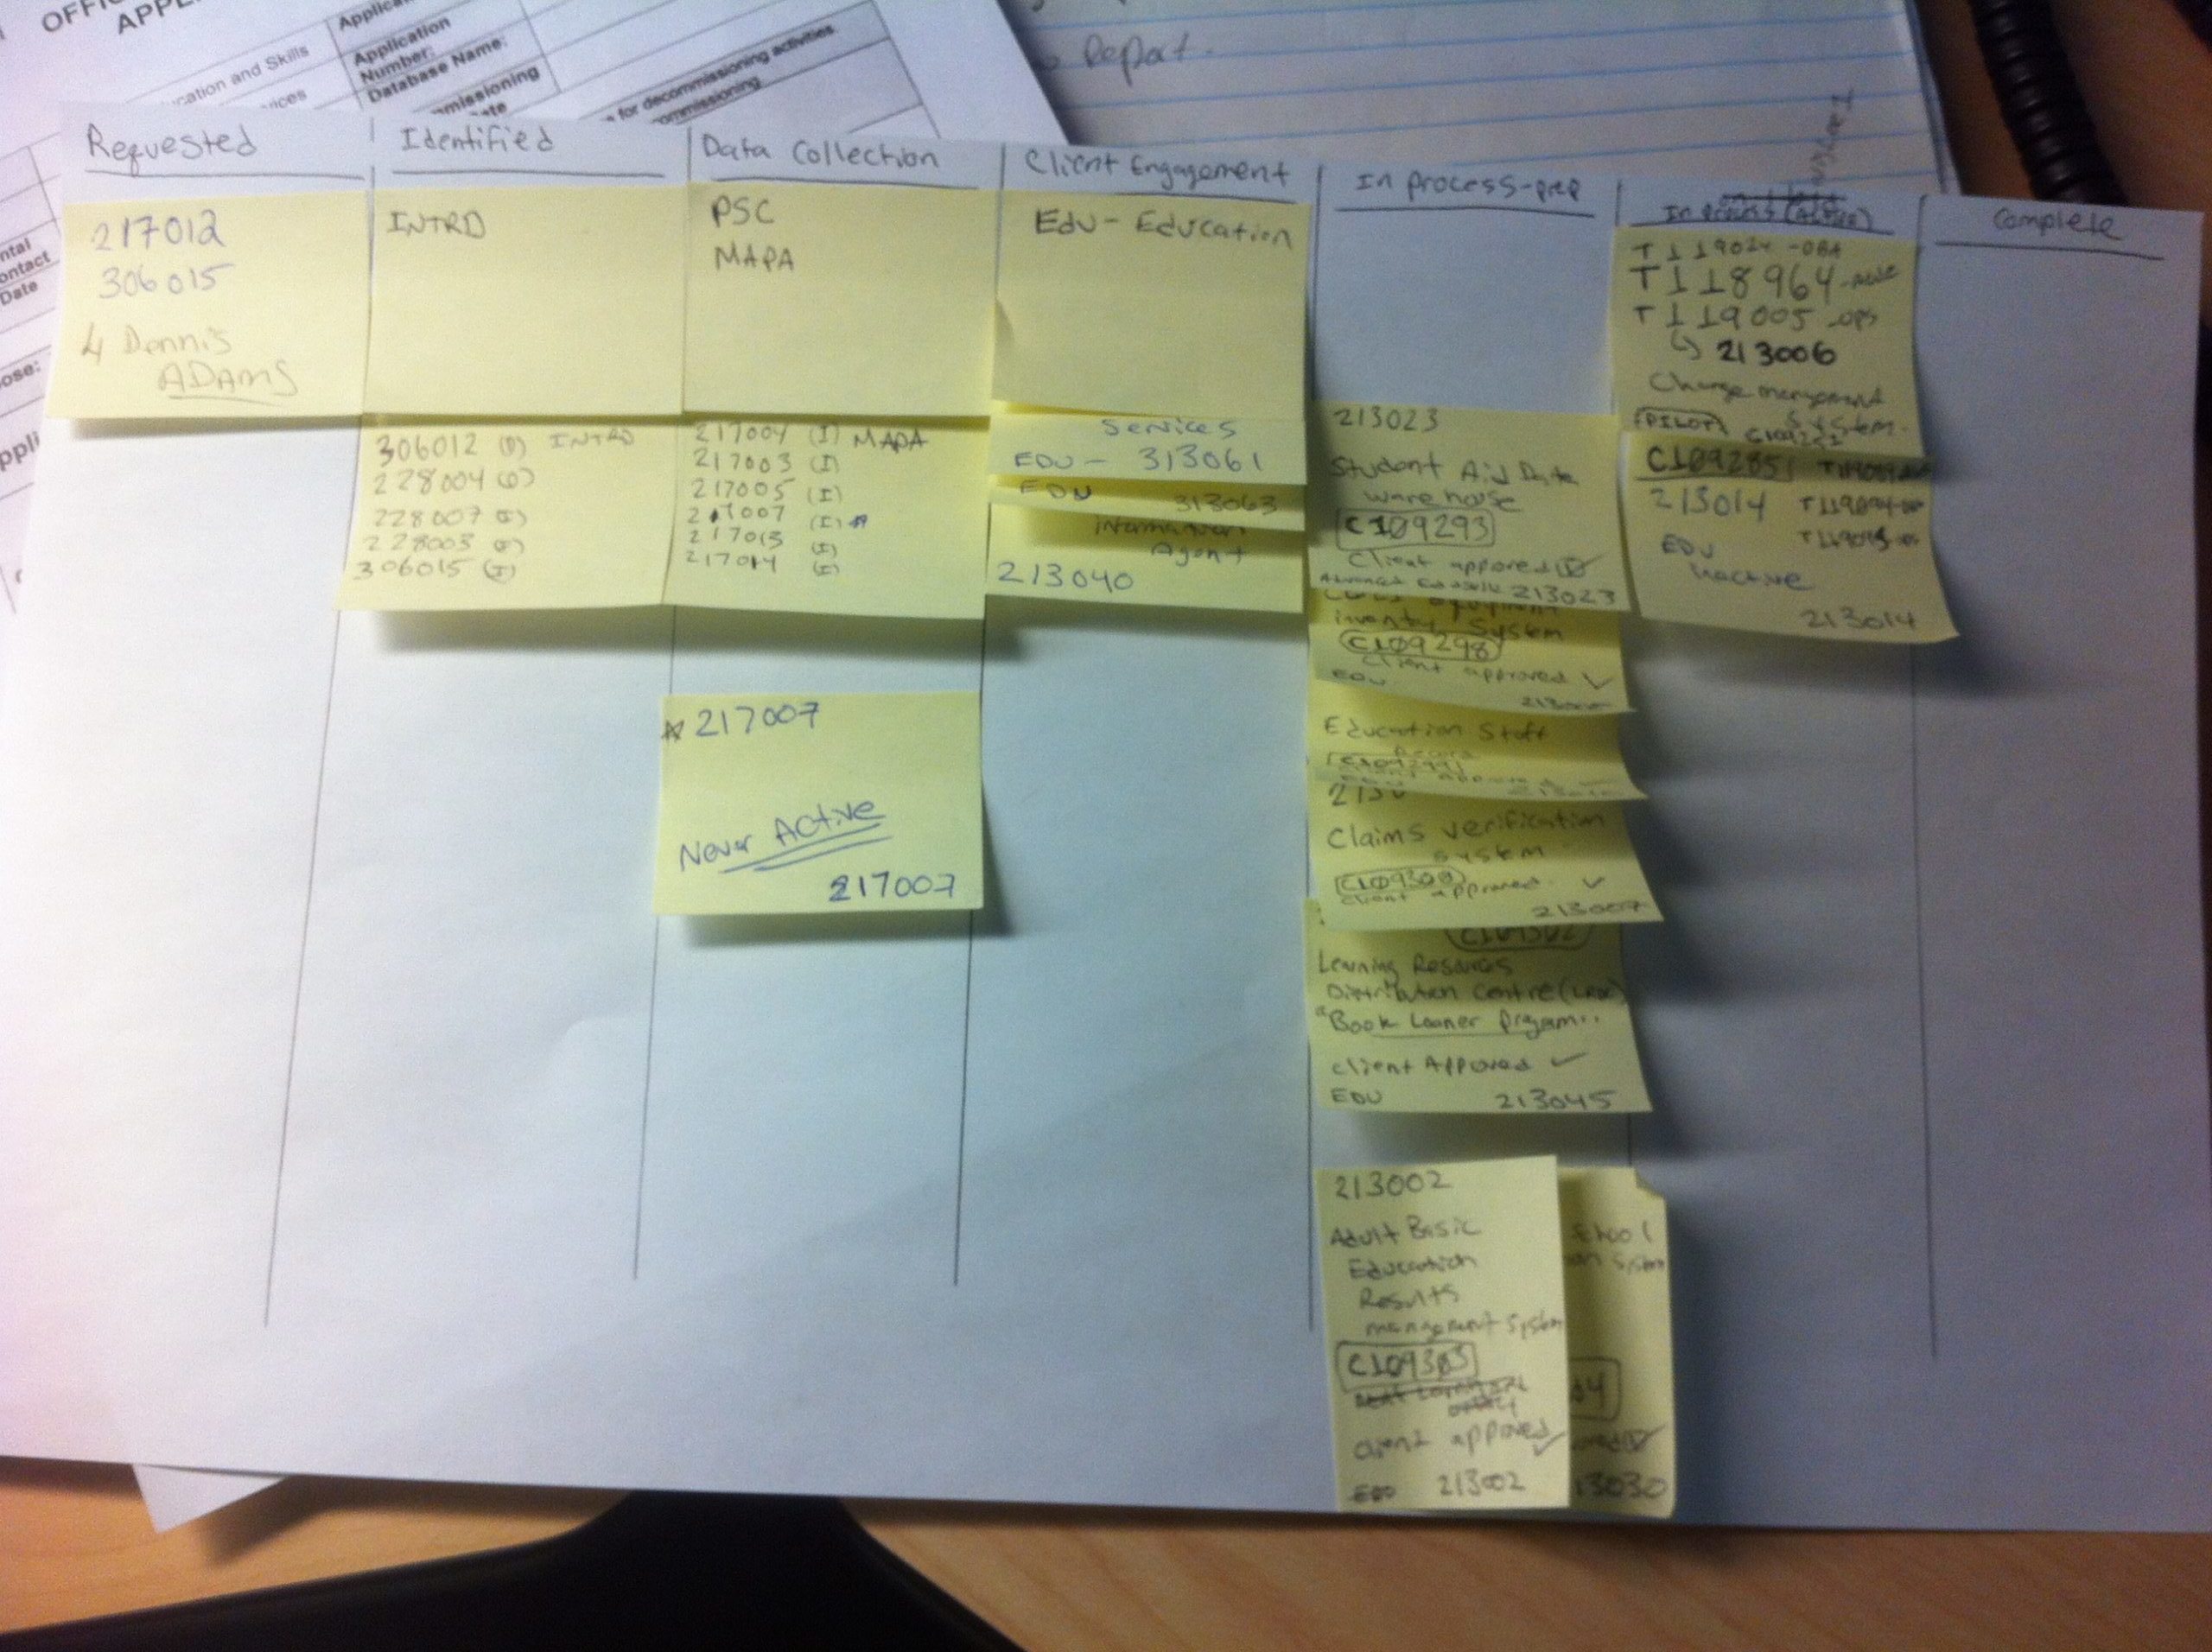
- Place each response on a Post-it, Flash card, or note.
- Place all the ideas on a wall, table, or workspace.
- Review all responses and look for ideas that seem to be related.
- Sort responses into groups until all Post-it, cards, or notes have been used.
- Sort large groups into subgroups for easier management and analysis.
- Subgroups are made up of issues, questions, opportunities, concerns, etc.
- Decide on a heading for each of the groups.
Discuss and agree upon a statement or phrase for the problem or opportunity that can be used in the affinity diagram. The affinity diagram will help you determine the problem as understood (PAU).
Once completed, the affinity diagram may be used to create a cause and effect diagram, also known as a fishbone or Ishikawa Diagram, and is used for Root cause Analysis.